
Budgeting #
Flexible budgeting tools to plan ahead and stay in control:
- Create Budgets by Category: Assign an amount and an optional end date to each budgeted category.
- Add Custom Categories: Easily introduce new categories tailored to your financial needs.
- Long-Term Budgeting: Set budgets for the next 12 months or automatically pre-fill using data from the previous 12 months.
- One-Time Monthly Budgets: Define one-time budgets for each month across the upcoming year for dynamic financial planning.
User Journey: Add a Budget #
Goal: Allow users to create a new budget by selecting a category, entering an amount, and selecting an end date.
Entry Point: #
- User navigates to the “Budget” tab
- Clicks the “+ Add Budget” button
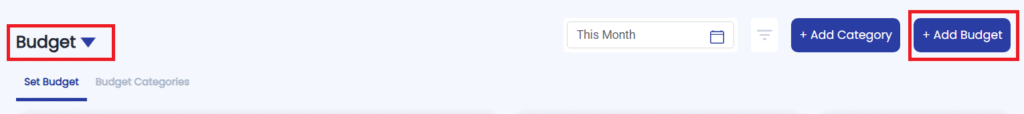
Steps: #
- User clicks “Add Budget”
- A modal or new screen appears with the Add Budget Form
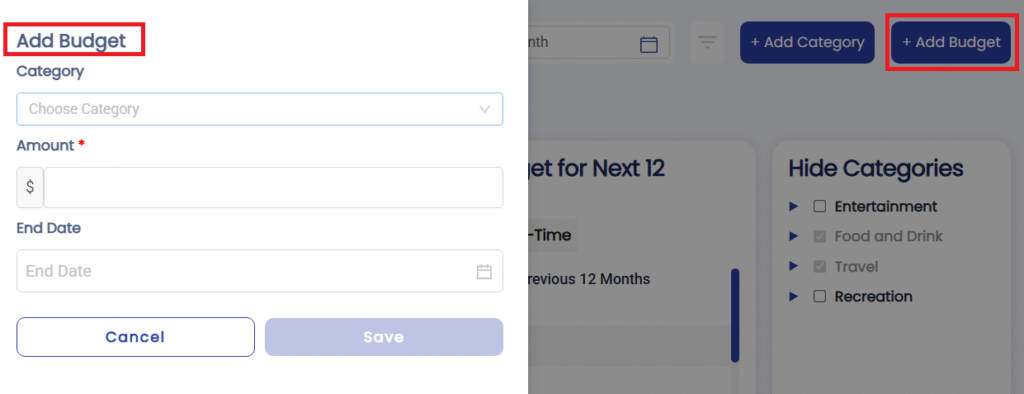
- A modal or new screen appears with the Add Budget Form
- User fills out the form fields:
- User reviews and submits
- Clicks “Save Budget” or “Add Budget”
- System validates required fields and shows confirmation
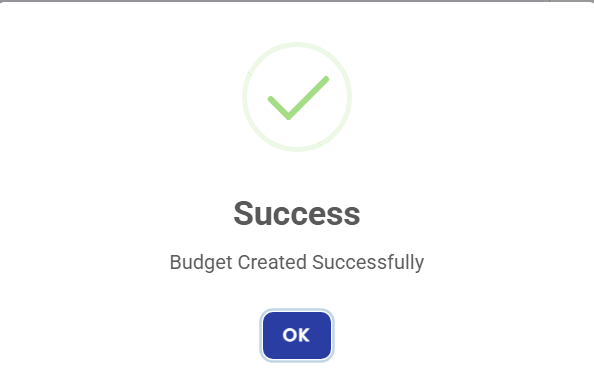
- System saves the budget
- Adds to the list of budgeted categories
- Updates the budget overview, progress bars, and income vs. expenses graph
User Journey: View Income vs. Expenses Graph #
Goal: Allow users to visually compare their income and expenses over time, helping them track financial balance and spending habits.
Entry Point: #
- User navigates to the “Budget” tab from main navigation
Steps: #
- User opens the Budget tab
- Overview of budgets is displayed
- A chart section labeled “Income vs Expenses” is visible
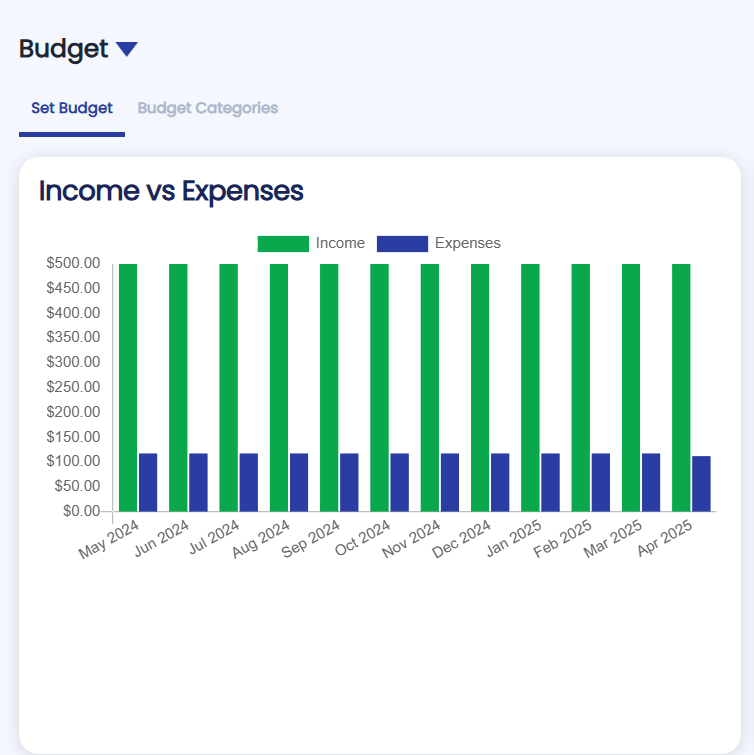
- System displays a bar graph
- X-axis: Time (e.g., by month: Jan, Feb, Mar…)
- Y-axis: Amount ($)
- Two bars per period:
- Income (Green)
- Expenses (Blue)
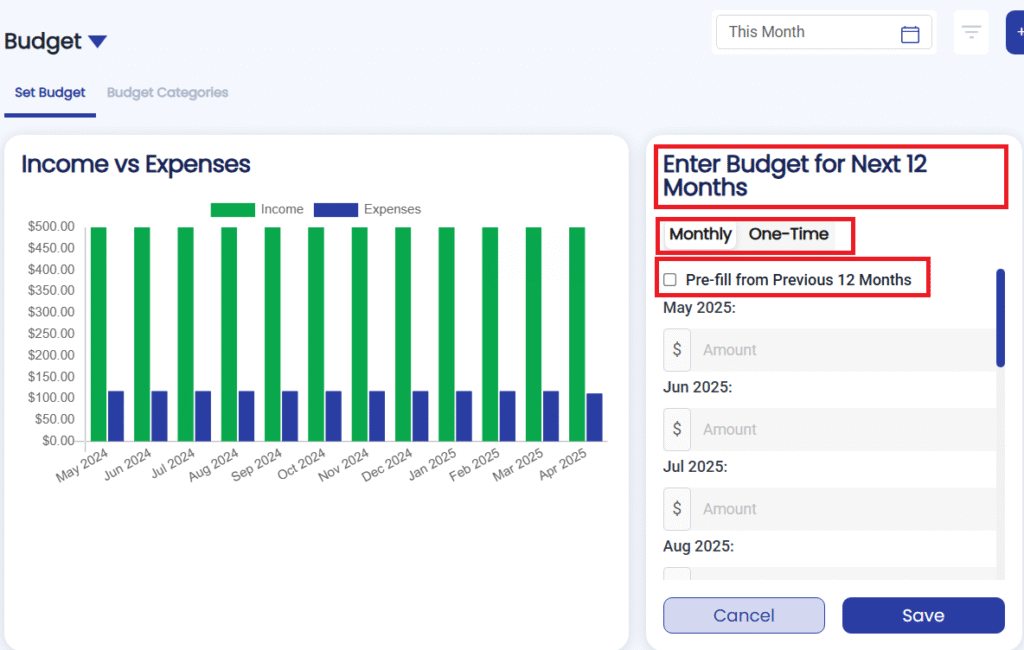
User Journey: Enter Budget for Next 12 Months #
Goal: Allow users to plan monthly budgets ahead for an entire year at once or separately for each month, either manually or using autofill from past data.
Entry Point: #
- User navigates to “Budget” tab
- Shows up “Enter Budget for Next 12 Months” form
Steps: #
- User is shown a 12-month input table (By Default Monthly):
- Each month’s budget field is editable
- User is shown a one input (When One-Time)
- Fix budget for each month (Next One Year)
- User fills in monthly amounts manually
- OR clicks “Autofill from last 12 months”
→ System fetches values based on past transactions
- OR clicks “Autofill from last 12 months”
- User clicks “Save Budget”
- System validates input
- Saves budget plan for each month.
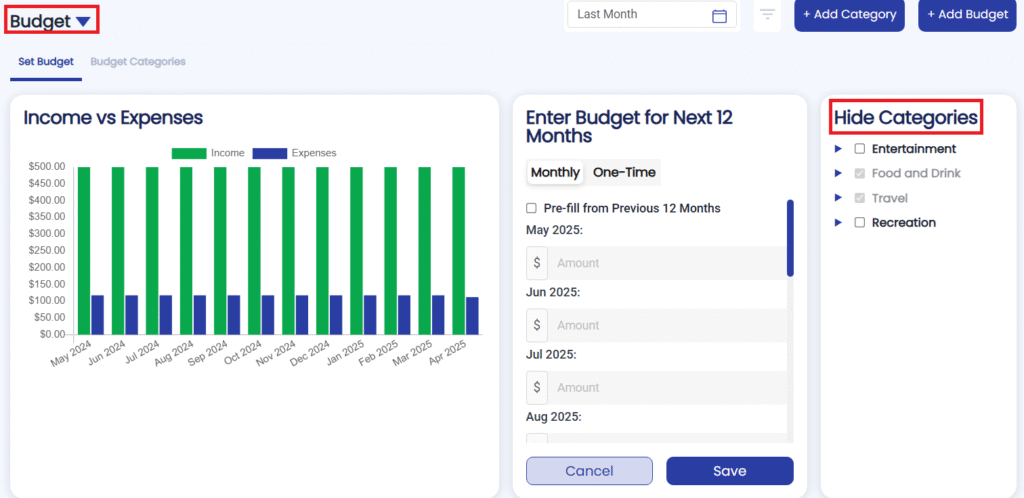
User Journey: Hide a Category from Income vs. Expenses Graph #
Goal: Allow users to exclude one or more unbudget categories from the Income vs. Expenses graph to focus on specific data or clean up the view.
Entry Point: #
- User navigates to the “Budget” tab
Steps: #
- User sees a list of categories with checkboxes:
- All are selected (✓) by default
- User unchecks one or more categories
- E.g., unchecks “Entertainment” and “Subscriptions”
note: “Unselected categories will not be shown in the graph”
- E.g., unchecks “Entertainment” and “Subscriptions”
- System immediately updates the graph
- Removes data for deselected categories
- Recalculates income and expense totals shown
- User can reselect categories anytime
- Changes are reflected live on the graph
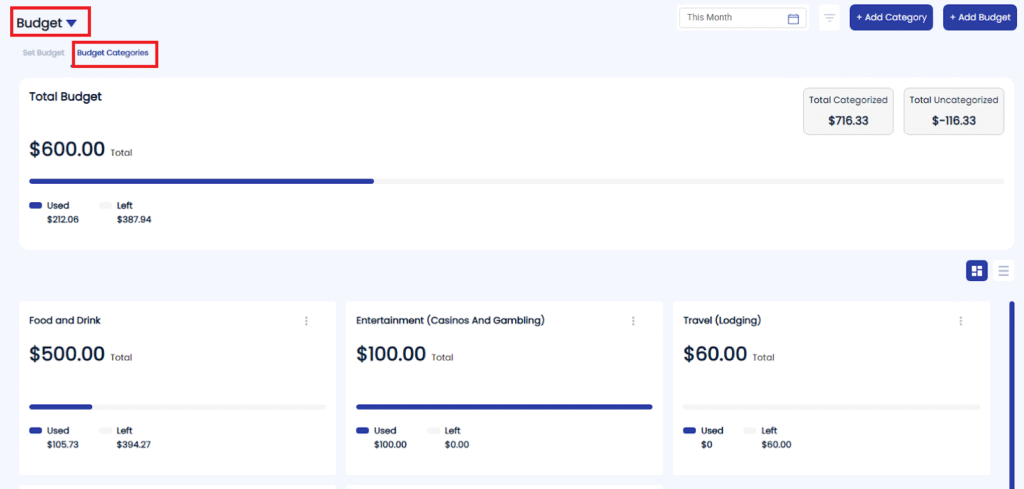
User Journey: View Budgeted Categories #
Goal: Allow the user to see a clear breakdown of all budgeted categories, including how much they’ve planned to spend, how much they’ve already spent, and what remains.
Entry Point: #
- User navigates to the “Budget Categories” tab
Steps: #
- User opens the Budget Categories tab
- Budget Overview screen loads automatically
- Display includes a list or card layout of all budgeted categories
- User sees the following data for each category:
- Total Budgeted: Amount user has allocated for the month (or selected period)
- Used: Amount already spent, based on categorized transactions
- Left: Remaining budget (Total – Used)
- Progress bar: Visual representation of how much is used vs left
- User can filter or sort:
- Sort by highest spent, lowest left, or category name
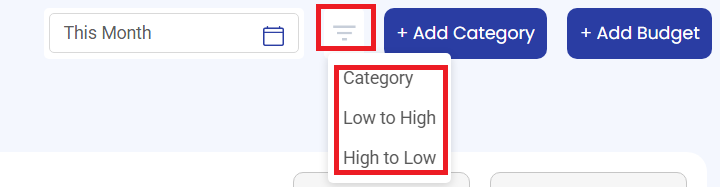
- Filter by this month, last month, last three months, last six months, last year, and this year.

- Sort by highest spent, lowest left, or category name
- User can click a category
- Opens a detailed view with individual transactions that contribute to the total used
- User can click on the Three Dots
- User can edit/delete the Budget


